Reports and analytics
Restaurant sales reports software that explains your numbers
AirQR gives you sales reports as you bill, with no spreadsheet to build. See today's sales, orders and average bill, your busy hours, how guests pay and which dishes earn real profit. At closing, a Z report sums up the day for your cash-up. It suits owners who want to know what happened in the hotel without standing at the counter.
- Live sales, no spreadsheet
- Stars, Plowhorses, Puzzles and Dogs
- X and Z reports for day-end
Restaurant sales reports software without the spreadsheet
Every bill you take in AirQR, whether it comes from a captain at the counter, a guest scanning the table QR code or an online parcel order, goes into one set of numbers. You do not export, paste or add anything up. Open the page and the figures are already there.
Most owners look at two places. The Overview page is a live summary of today at your outlet. The Analytics page lets you pick today, the last 7, 30 or 90 days, and compares each number with the period just before it. Only closed, paid orders are counted, so open checks and cancelled orders do not inflate your sales.
For the day-end, AirQR makes a Z report each time you close the cash drawer. It is the page to print, sign and keep with the cash. Read more about it in cash drawer and Z reports. If you also need tax reports for your accountant, see GST billing.
Restaurant analytics you can read in a minute
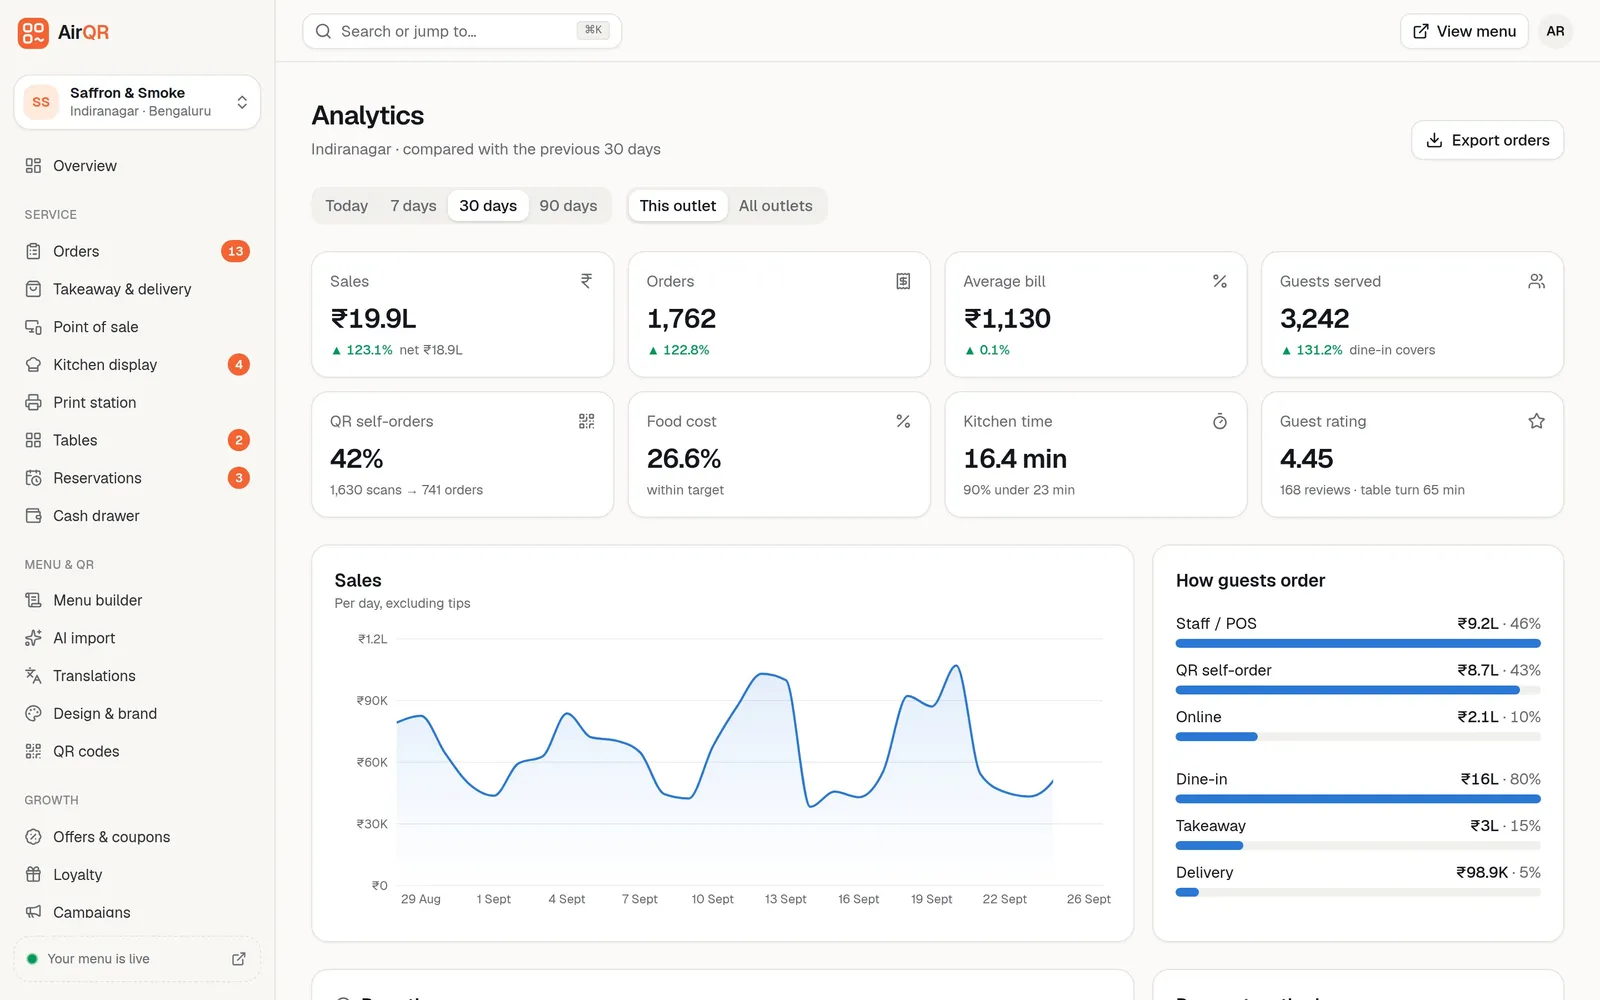
The cards at the top of the Analytics page answer how the period went. The first four also show the change against the period before. The screenshot above uses sample data for a demo restaurant.
- Sales, with the net figure before tax and after discounts, and refunds when you have recorded any
- Orders and average bill
- Guests served, meaning dine-in covers
- QR self-orders, with how many scans turned into orders
- Food cost as a share of net sales, marked within or above the 35% target
- Kitchen time, the average minutes from order to ready
- Guest rating, with the number of reviews and the average table turn time
What the sales reports show
Below the cards, a few panels answer the questions owners ask most.
Sales trend
A chart of sales per day, tips left out, so you can see which days of the week are strong and which are slow.
How guests order
Sales split by where the order came from (QR self-order, staff at the POS or online) and by type (dine-in, takeaway or delivery).
Busy times
A heatmap of orders by weekday and hour. Darker squares are busier. Use it to set staff rosters and kitchen prep around the rush.
Payment methods
Money taken by UPI, card, cash and other, with the count of payments, plus taxes collected and discounts given.
QR scan funnel
How many times your QR codes were scanned and how many orders came in. Many scans and few orders suggests guests are only browsing.
Compared with before
Every headline number shows the change against the previous period, so you see if a week was better or worse than the one before.
Menu engineering, in plain words
Your best-selling dish is not always your best earner. Menu engineering puts every dish that sold on a chart by how popular it is and how much profit each plate makes, then sorts it into one of four groups.
Stars are popular and profitable, so keep them prominent and do not discount them. Plowhorses sell well but earn little, so nudge the price up or trim the portion cost. Puzzles earn well but few people order them, so try a better name, a new photo or a badge. Dogs are neither, so rework or retire them. The paneer tikka that sells every night but leaves you a thin margin is a classic Plowhorse.
To classify dishes AirQR needs a food cost for each one. Type it into the menu builder, or build a recipe in inventory and AirQR works the cost out for you. You need at least three costed dishes before the chart appears. See the menu engineering guide for the full method.
Under the chart, an item performance table lists your best-selling dishes by revenue with quantity sold, food cost percentage, margin per plate and the group each one falls in. A shorter review every month or two is enough, since changes take a few weeks of sales to show.
X and Z reports for the day-end cash-up
A Z report is your restaurant daily sales report for the cash-up at closing. An X report is the same summary for a drawer that is still open.
- When
- X reportWhile the drawer is open
- Z reportWhen you close the drawer
- Figures
- X reportLive, they keep changing
- Z reportFrozen at closing, never change
- Counted cash and variance
- X reportNot yet
- Z reportIncluded
- Use
- X reportA mid-shift look
- Z reportPrint, sign and file it every day
- Printing
- X reportA4 or thermal printer
- Z reportA4 or thermal printer
The Cash drawer page also shows live mid-shift figures, so you can check the drawer without closing it.
What is on a Z report
It is a one-page summary of the drawer session at your outlet.
Sales
Orders closed and cancelled, gross sales, discounts, net sales, service charge, each tax line, tips and total billed.
Payments
Cash, card, UPI, online prepaid and other, with the amount and count for each, and refunds when there were any.
Channels and voids
How many closed orders came from the POS, the table QR and online, and the number and value of voided items.
Cash count
Opening float, cash sales, cash in and out, expected cash, counted cash and whether you are balanced, short or over.
Today at a glance on the Overview page
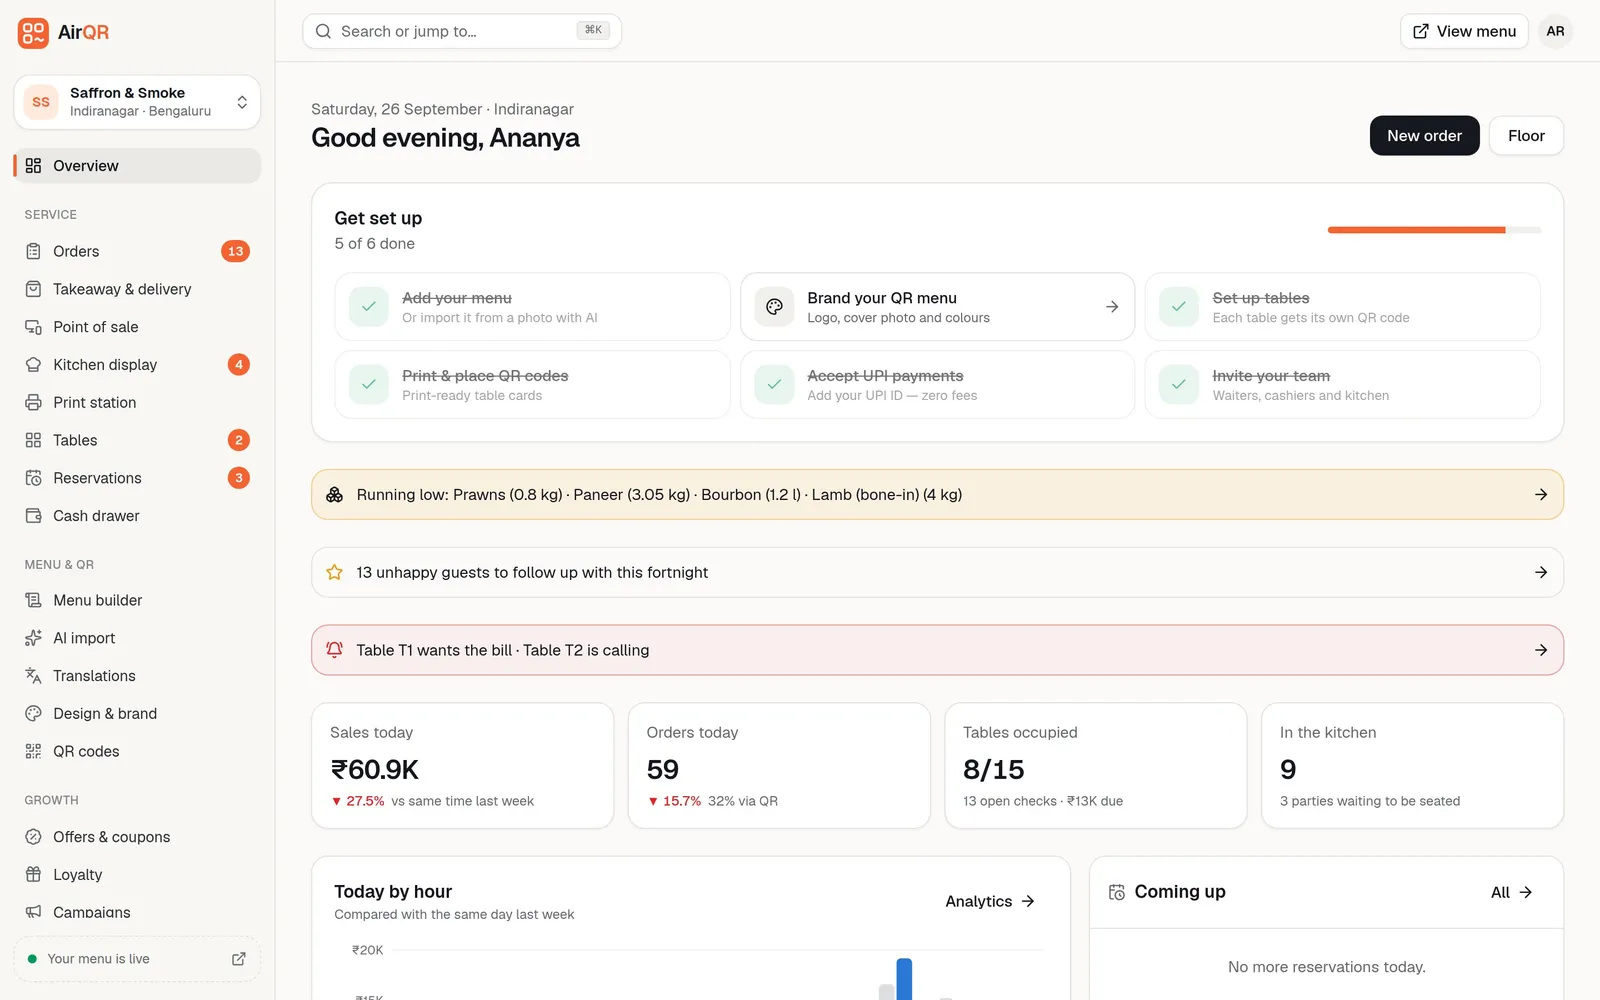
Owners and managers see Sales today compared with the same time last week, orders today with the share that came by QR, tables occupied with the amount still due, and a sales-per-hour chart against the same day last week. Coloured alerts only appear when something needs you, such as low stock or unhappy guests to call back.
Every order behind those numbers is listed on the Orders page, where you can search by order number, guest name or phone and open any check to see its rounds, bill and payments. See the orders page.
Take your data with you
Your data is yours and you can download it any time as CSV files that open in Excel or Google Sheets.
- Export orders from Analytics for the last day, 7, 30 or 90 days, one row per order
- Download all your data as one ZIP, including daily sales, item sales, busy hours and key numbers
- GST reports and Tally import files from GST and accounts
- Guest lists, payroll and tips files from their own pages
- Exports stay in English so your accountant and spreadsheets can read them
- After you cancel, your data stays downloadable for 30 days
Questions
What is the difference between an X report and a Z report?
An X report is a live summary for a cash drawer that is still open. A Z report is created when you close the drawer, is frozen at that moment and includes the counted cash and any variance.
How do I get a daily sales report for my restaurant?
Open Analytics and choose Today for live sales, orders and average bill. For the day-end cash-up, close the drawer and print the Z report. You can also download daily sales as a CSV.
Why do my Z report sales differ from my Analytics sales?
The Z report covers only the time between opening and closing one drawer session at one outlet. Analytics uses the dates and filters you choose, so the two can differ.
What do I need before menu engineering works?
Food costs on at least three dishes, either typed in the menu builder or worked out from recipes in inventory. A dish is classified once all its sales in the period have a cost.
Does Analytics count open and cancelled orders?
No. Only closed, paid orders are counted, so close open checks after payment or your numbers will look lower than expected.
Can I compare my outlets in one place?
Yes. With more than one outlet, switch Analytics from This outlet to All outlets and the page shows sales and orders for each outlet side by side. See multi-outlet management.
Can I get my reports into Excel or Tally?
Yes. Orders and many other reports download as CSV files, and GST and accounts has Tally Prime import files for your accountant.
Keep reading
Try AirQR in your restaurant
Set up in minutes on the phones, tablets and printers you already have. 28-day free trial.